What I see in Github contributions


I have seen several people sharing their contribution graph in Github. Some of them, bragging about how dark and green their graph is. A few were very proud of them not having any blank square. I am not happy with that kind implications: more hours, no rest days, … They don’t mean you are working harder. Just mean that you are working more hours. Besides, more contributions to a repo don’t mean that they are better. Just that you have committed more times.
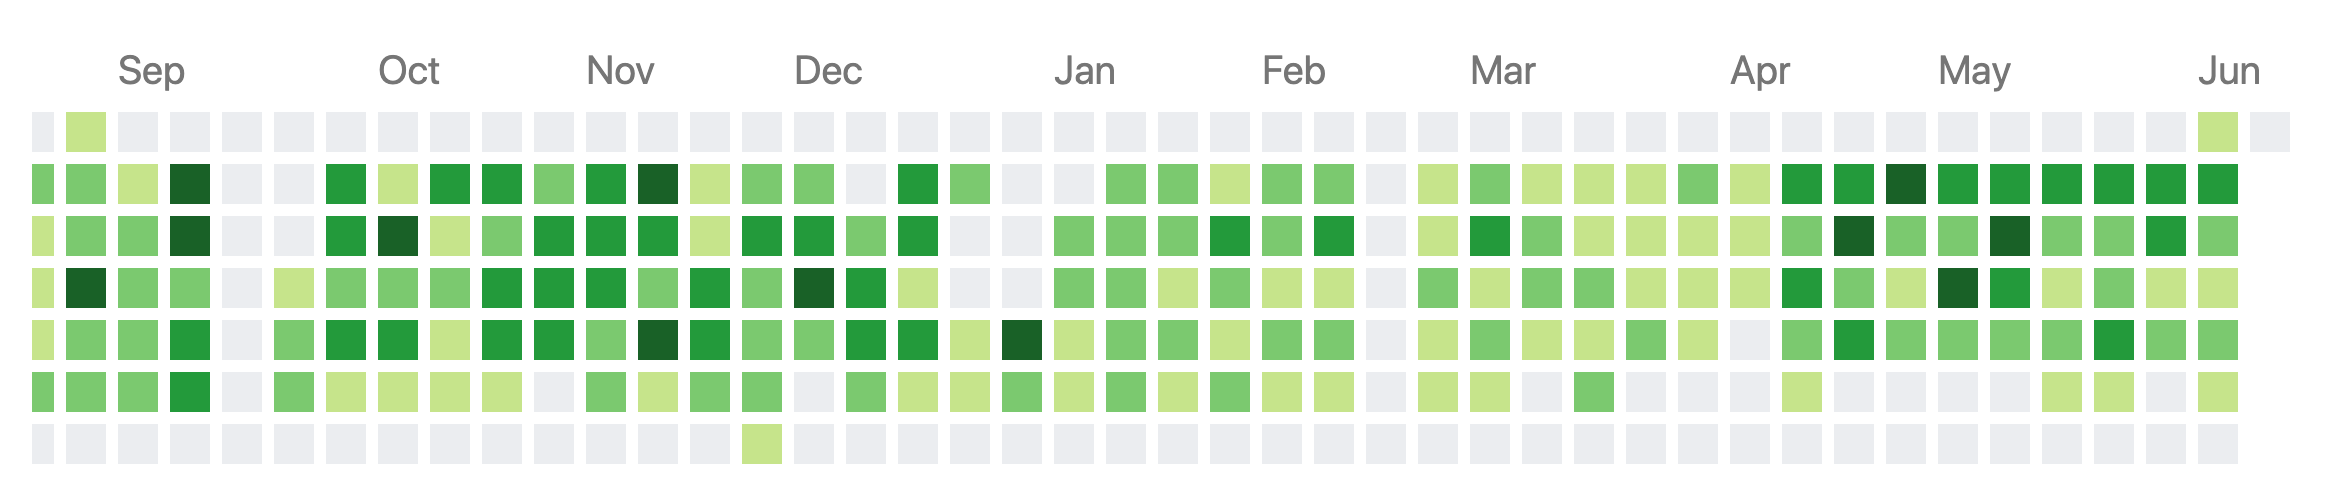
With that being said, I find this graph quite interesting. I can see my progression during the year: my holidays periods (blank columns), my weekends (blank rows), busier times at work (darker points). I could probably tell some of the functionality we launched seeing the color of the squares of that month.
I am not particulary fond of how green it is. I am specially dispised with the green dots on the first and last rows: they are commits on weekends. And that means hotfixes: that is, something that was wrong in production and needed to be fixed right now. I count 3 this year. It’s not a high number considered the pace of development and how many developers we are in Playtomic. But yikes.
That number has to be zero.