Performance and MongoDB

If you, a backend developer, had to describe your job, what would you say? We usually talk a lot about servers, clusters, layers, algorithms, software stacks, memory consumption, …
We put data into databases and we get it back as fast as we can. Databases are our cornerstone. Why don’t we talk more often about them? We are always relying on our ORMs.
My best advice? Simplify your queries. Simplify your data models. Simplify your access patterns.
Performance in MongoDB
Metrics
If you are using MongoDB, these two metrics will be your best friends:
- Scanned Documents/Returned ratio
- IOPS
Scanned docs/returned: it means how many documents you are reading from disk vs the number of documents you are actually returning in your find() or aggregate(). Ideally: this should be 1 (every document read is returned). The only way to get it? All your queries must be covered by indexes. Indexes are in memory (or they are if they fit), so MongoDB doesn´t have to read and filter them from disk.
IOPS: I/O operations per second. That is, operations on disk. It is correlated with scanned docs, as they are read from disk. But there are more sources of IOPS, for example writes. Your disk will give you a limit to your maximum IOPS. Ours is 3000.
Your goal is to keep IOPS below that threshold, and as low as possible. It is hard to know how many IOPS your query consumes, but it is easy to know the scanned docs/returned ratio.
Tools
How can you analyze why your database is behaving as it is?
MongoDB Profiler If you can afford to enable it, do it now. It’s the best source of info. We use the Atlas MongoDB Profiler and it is worth every penny.
Explain planner
The planner is the key to understanding your access patterns.
There are several ways of calling it, but you can start with explain() after your cursor:
db.our_collection.find(query).explain()You can use add executionStats to get more data about the query.
db.our_collection.find(query).explain("executionStats")There are many stages, but these ones are the most important:
- COLLSCAN: the query is scanning the collection in disk. Pretty bad, as no index covered the search, so MongoDB has to read the whole collection.
- IXSCAN: the query is using an index to filter. It doesn´t mean that all the query is covered by the index, but at least some part.
- FETCH: the planner is reading the documents from the collection. If your query is returning documents, you will get a FETCH stage probably (unless your query is covered by the index).
This is an example of one of our queries:
winningPlan:
      { stage: 'COLLSCAN',
        filter:
         { '$and':
            [ { '$or':
                 [ { 'invitaed_user_id': { '$eq': '1' } },
                   { owner_id: { '$eq': '1' } },
                   { 'player_id': { '$eq': '1' } } ] },
              { is_canceled: { '$eq': false } },
             ] } },
This is not good, as it is scanning the whole collection.
Another one:
db.our_collection.find(query).explain("executionStats")
executionStats:
   { executionSuccess: true,
     nReturned: 22,
     executionTimeMillis: 0,
     totalKeysExamined: 24,
     totalDocsExamined: 22,
     executionStages:
      { stage: 'FETCH',
        nReturned: 22,
        docsExamined: 22,
        inputStage:
         { stage: 'OR',
           nReturned: 22,
           inputStages:
            [ { stage: 'IXSCAN',
                nReturned: 0,
                indexName: 'example-index-1',
                indexBounds:
                 { owner_id: [ '["1", "1"]' ],
                   start_date: [ '[MaxKey, MinKey]' ] } },
              { stage: 'IXSCAN',
                nReturned: 22,
                indexName: 'example-index-2'
                indexBounds:
                 { 'player_id': [ '["1", "1"]' ],
                   start_date: [ '[MaxKey, MinKey]' ] ] },
                keysExamined: 23,
                dupsDropped: 0 }] } } },
Here you can two see IXSCANs, merged by and OR. After that, the query is fetching the documents. I am reading the query inside-out. example-index-1 is used to resolve one part of the query, and example-index-2 for the other part.
Sometimes you will get a FETCH just after an IXSCAN: it means that the index covers only part of the filter. After that, the planner needs to read the documents from disk to finish the filter.
The complete list of stages? You need to check the code.
Simplify your queries
$ors
$ors are the devil. You, as a programmer, are used to thinking in $ors. You add a few $ors, your condition gets much more expressive. But guess what? Your query has gotten exponentially more complex. With every condition you add to the $or, you are adding one more combination of parameters.
How does the planner resolve all those combinations? It needs an index for each of them.
Do you remember the explain() above? The query was:
{
	$or: [{"owner_id: "1"}, {"player_id: "1"}].
}
The indexes used?
example-index-1: {"owner_id: "1", "start_date": 1}
example-index-2: {"player_id: "1", "start_date": 1}
And here is another tip: bigger indexes can cover smaller queries as long as the fields are at the beginning of the index. We are not using start_date to filter.
What would happen if I add an extra $or? { $or: [{“owner_id: “1”}, {“player_id: “1”}]. $or: [{“is_canceled”: true}, “start_date”: {$gt: ISODate(“2022-02-02T00:00:00)}] }
Then there would need 4 combinations:
{owner_id, is_canceled},
{owner_id, start_date},
{player_id, is_canceled],
{player_id, start_date},
Denormalized fields
If you find yourself filtering by several fields within an $or, or sorting by several fields, consider adding a denormalized field (based on the others).
Yeah, my apologies to the third normal form.
Keep reading, we will give an example pretty soon using the so-called Summary Pattern.
nulls are always the minimum value
This is a minor trick, but still useful. Let’s say you have a nullable field, and you have to filter (or sort descending) by that field.
You will probably find yourself using a query similar to this:
{
 $or: [
        field: {$exists: false},
        field: {$lte: value}
      ]
}
That is, if the field is null, then it passes the filter. Otherwise, compare. We used this filter to check if a player could join a match given their level and the level restrictions of the match.
That’s an $or. We don’t like $ors. What would happen if we compare our value to null? Let’s check the sorting rules in MongoDB.
MinKey (internal type)
Null
Numbers (ints, longs, doubles, decimals)
Symbol, String
Object
...
MaxKey (internal type)
That is, null is always the lower value when comparing (except for the MinKey object, we will talk about it later).
Our query can be simplified by this:
{
  field: {$lte: value}
}
It works for $lt and $lte (lower than and lower or equal).
It works too if you are sorting by descending order of field {field: -1} because the object with null will be at the end of the sort.
Counts are costly in MongoDB
Counting seems an easy operation, but it is not. Even if you have an index, MongoDB needs to traverse the index due to the way MongoDB builds B-trees: they don’t store the number of leaves that the sub-tree have. So they need to traverse the index until the end.
Again, if you are counting using a query with $or, it makes the counting even more complex: the query needs to take into account possible repeated documents.
For example, we used counts to compute the position of a player in a ranking (the original query was even more complex).
{ranking_id: ?0},
{
 $or: [
		{ value: {$gt: ?1}},
    { value: {$eq: ?1}, last_modified: {$gt: ?2} }
 ]
}
It required several indexes to count:
{ranking_id: 1, value: -1}
{ranking_id: 1, value: -1, last_modified: -1}
How can we avoid counting on several indexes? Add a single field that summarize the fields that you are filtering.
For example: weight = append(value, last_modified)
With that new field, we only required one single index:
Indexes:
{ranking_id: 1, weight: -1}This is called the Summary Pattern.
How to build indexes
Ok, indexes are our best tool to keep MongoDB as performant as possible. So the next step, how do we know what indexes we should build?
Performance advisor
If you are in Atlas, use the Performance advisor.
At some point, you will know your system better than the Performance Advisor, but it is a good starting point.
Clone your production collections and explain() it in local
Test your indexes thoroughly before you put them in production: - it takes a lot of IOPS to build them.
- once you built it, the planner is taking it into account too, even if it is not finally used.
Remember what we said before:
- COLLSCAN: bad.
- IXSCAN: good.
- FETCH: good if it is the final step. Bad in between.
Others that you will see:
- COUNT: ok.
- MERGE: ok-ish, you probably could do better.
- MERGE_COUNT: good.
By the way, there are blocking and non-blocking stages, meaning that a stage needs to wait for the previous one before it can start computing results.
ESR: Equal-Sort-Range
Have you ever wondered what fields should go first in an index? You need to follow this rule:
- Fields filtered by equals ($eq, $in in some cases, …) go first.
- Then fields used in the sort stage. Remember that the index has to be built in the same order as you are sorting.
- Then fields filtered by a range ($lt, $lte, $gt, …).
ESR is the most useful rule you will find to build indexes. You should read as much as you can about it until you understand it.
This post by Alex Belilacqua is a gem.
Disambiguate equals
If you have two fields that are going to be filtered by $eq, what should go first?
The answer is that it doesn’t matter. You don’t need to worry about having a more balanced tree.
Just keep in mind the ESR rule. If one of them goes in a sort or a range, then it goes the latter.
Rollover process
Building an index is one of the most costly operations. Your IOPS will go nuts. If you need to do that in your production environment, and your collection is big enough, then we recommend you to use a rolling process. It starts the index build in a secondary, then promotes it to primary once the build is finished. You will be able to build any index even when your database load is high.
In Atlas, it’s just one click.
Remove / Hide indexes
The more indexes you have, the worst for the planner. The planner runs the query through the indexes it has and then takes the most promising.
Again, counting when you have several indexes is pretty bad.
Sometimes, you cannot just remove an index in production. You can check using your profiler if it can be removed but you might not be 100%. One not-frequent query might launch a COLLSCAN and then you would miss that index.
Luckily, since MongoDB 4.4 you can hide indexes. We use them to detect what indexes we can remove safely.
Limit your queries
Have you set a maximum limit of time to your queries? Why not? Do your clients have a request time out? Then it can be a healthy practice to avoid unexpected uses of your APIs.
db.our_collection.countDocuments(query, {maxTimeMS: 100})
MongoServerError: Error in $cursor stage :: caused by :: operation exceeded time limit
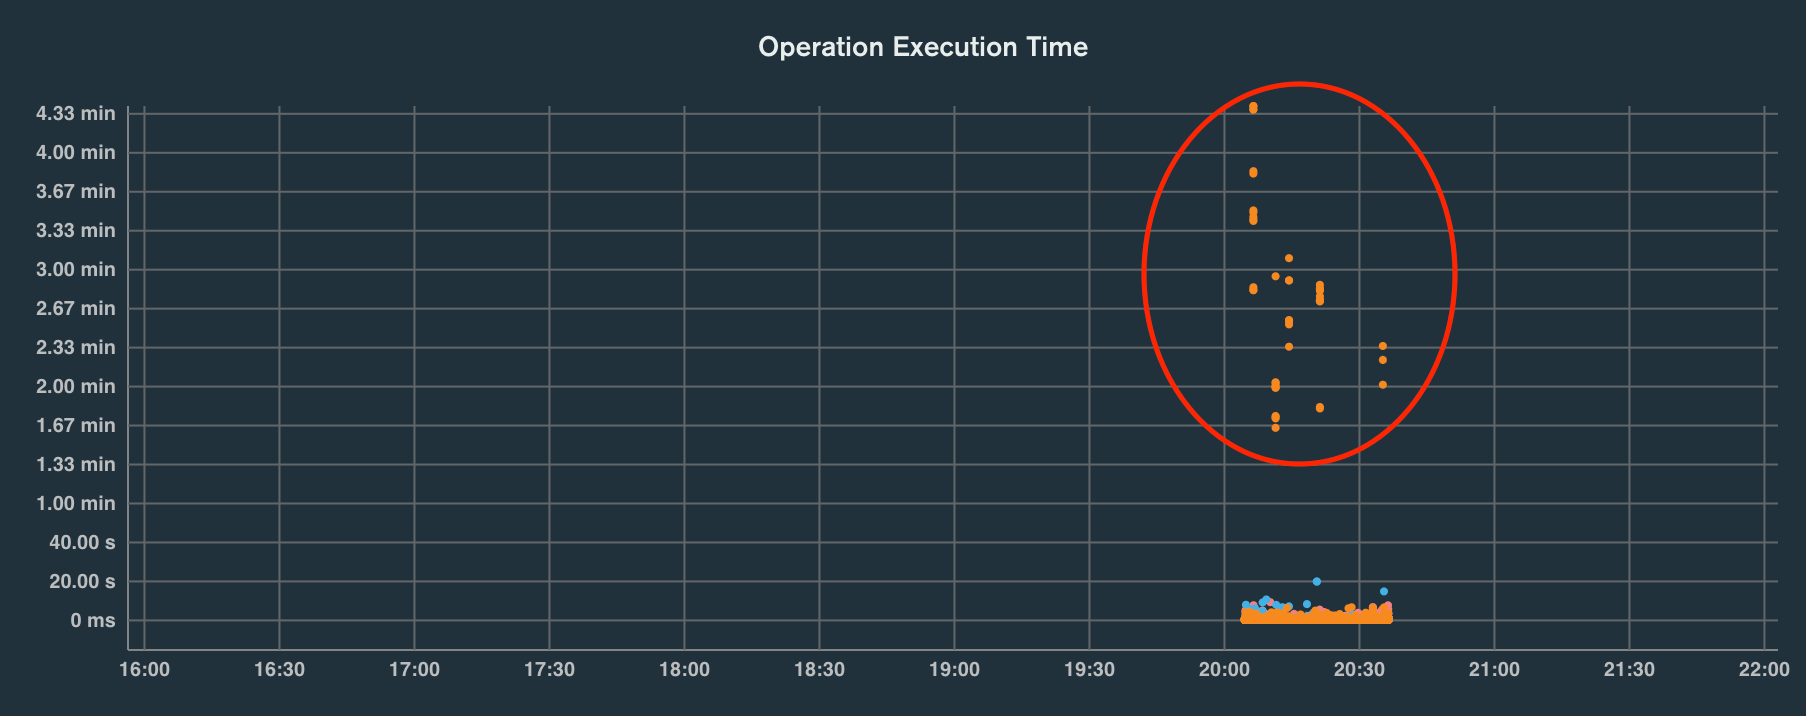
Do you see all these orange dots? No one was waiting for the backend to reply.


