The path to observability

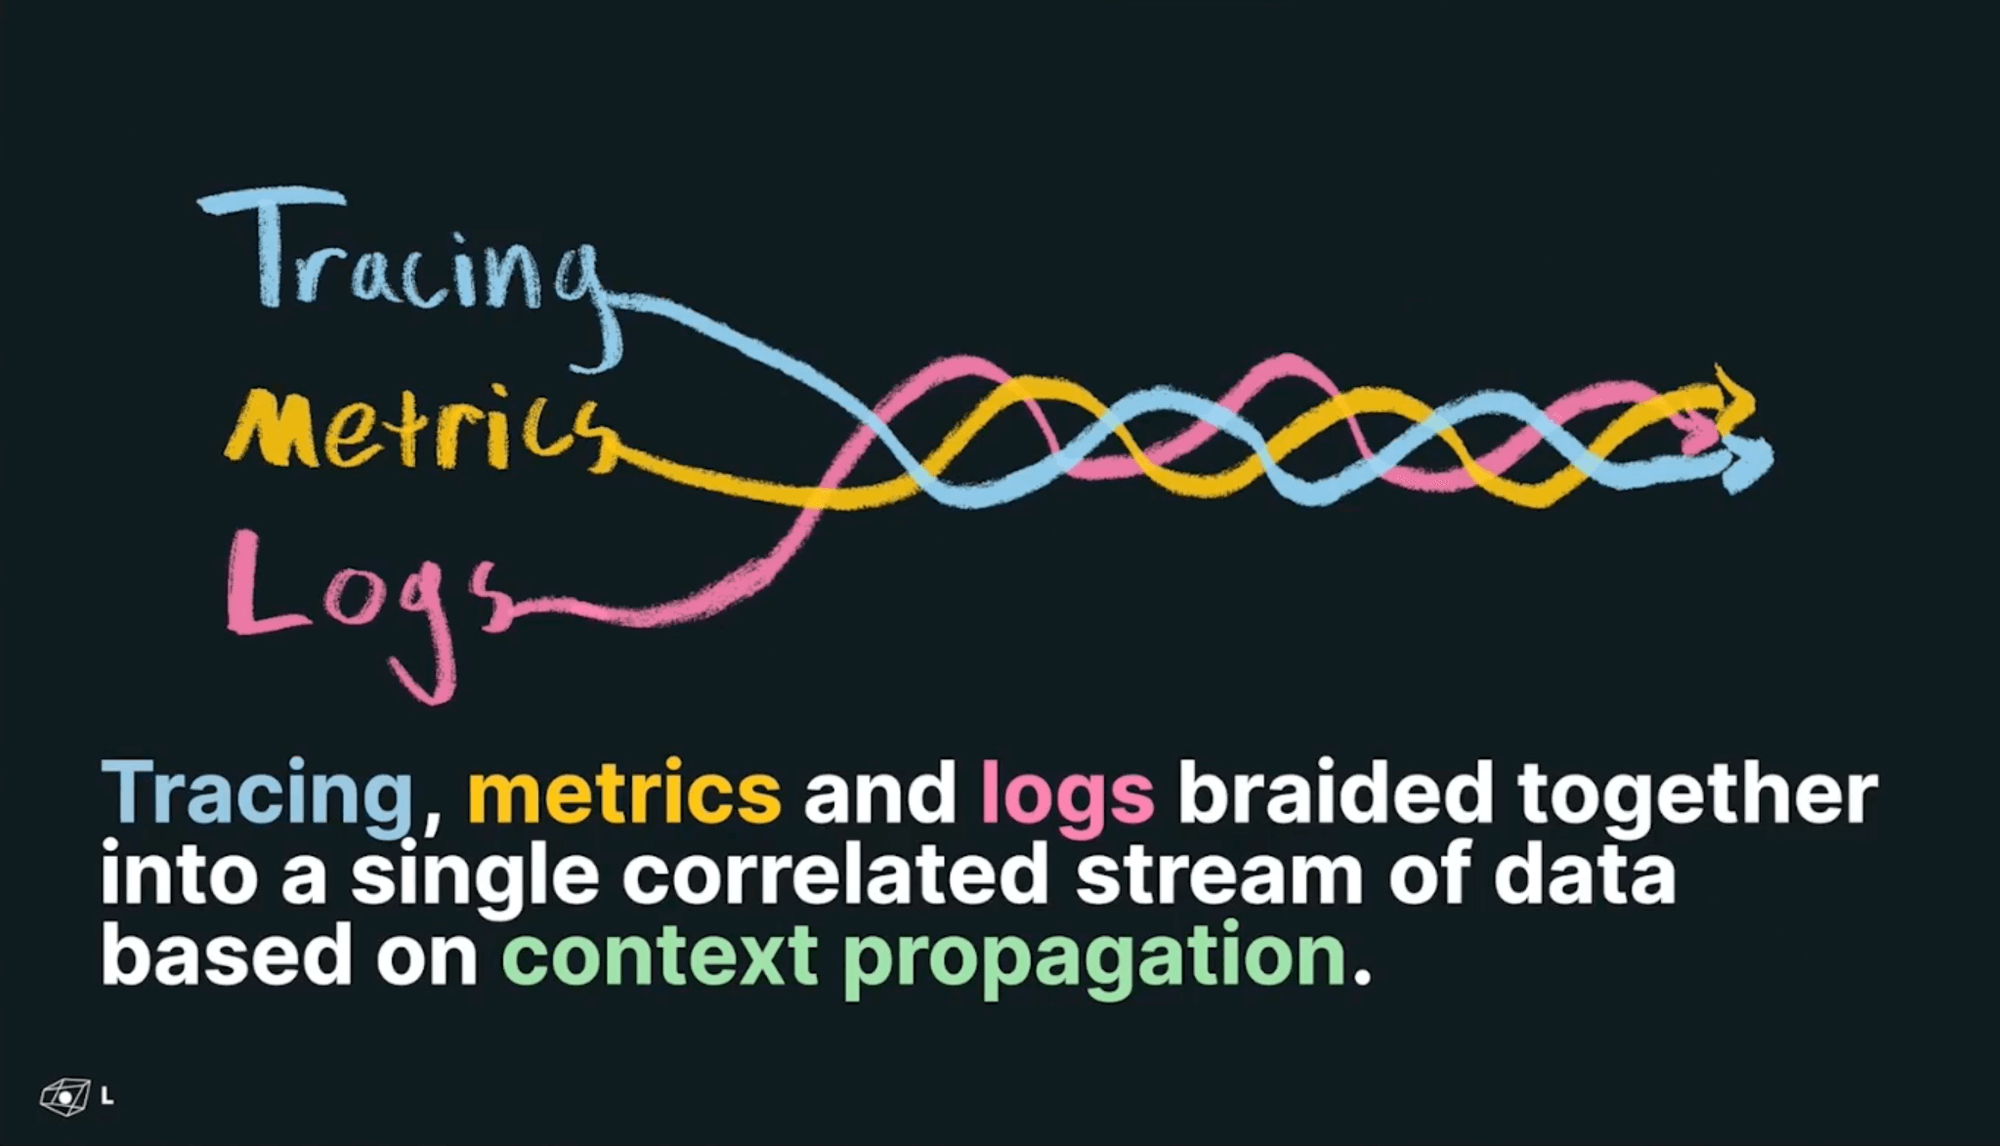
o11y = observability = logs, metrics, traces 1
This post is a summary of the steps we unconsciously followed in Playtomic when digging into the world of SRE (Site Reliability Engineering).
Logs
Most of the people is already comfortable with logs. I have always been a fan of the 12-factors app design, and they have a chapter about logs. Just throw them to the stdout and treat them as a stream. As our services run in docker containers, we just read the logs from docker. With logstash+filebeat you can massage and forward them somewhere else (an elasticsearch, logz, datadog, …)
anemone_configuration.1.ip.eu-central-1.compute.internal    | 2021-05-25 08:44:44.080  INFO [configuration-service,65360f43df5797ee,65360f43df5797ee,3187176603182004136,7845016010104016623,767246] 1 --- [  XNIO-1 task-5] c.p.a.s.IgnorableRequestLoggingFilter    : After request [GET uri=/v2/status/version_control?app_name=playtomic&app_version=3.13.0&device_model=iPhone&os_version=14.5.1&platform=ios;user=one.user@gmail.com;agent=iOS 14.5.1;ms=1]
anemone_configuration.1.ip.eu-central-1.compute.internal    | 2021-05-25 08:44:44.087  INFO [configuration-service,5fe21e342fb8cac9,5fe21e342fb8cac9,4868272858418826990,131548911514375389,767246] 1 --- [  XNIO-1 task-6] c.p.a.s.IgnorableRequestLoggingFilter    : After request [GET uri=/v2/configuration;user=one.user@gmail.com;agent=iOS 14.5.1;ms=8]
Metrics
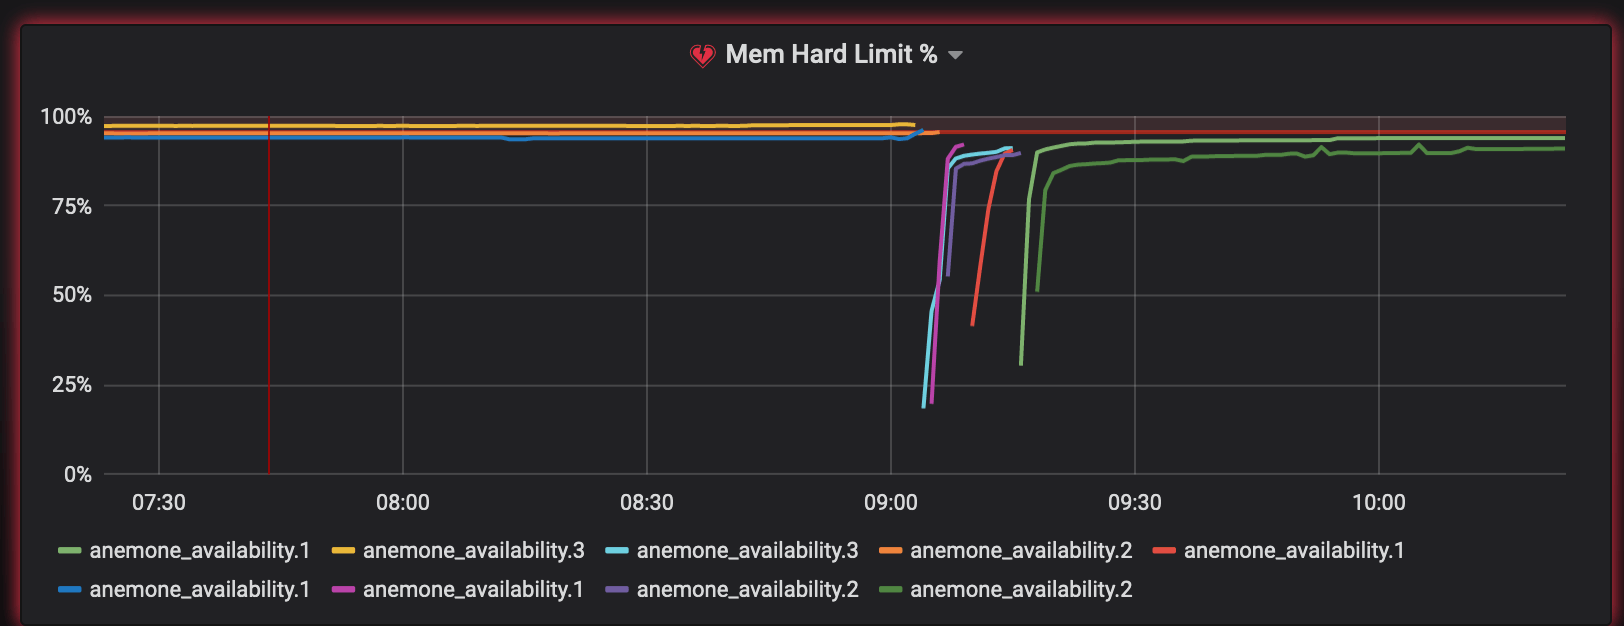
Metrics are also quite known in the community, thanks to prometheus and grafana. What is most unknown and super useful is to have them correlated somehow. Probably via tags/attributes to identify hosts, containers, environments, …
Traces
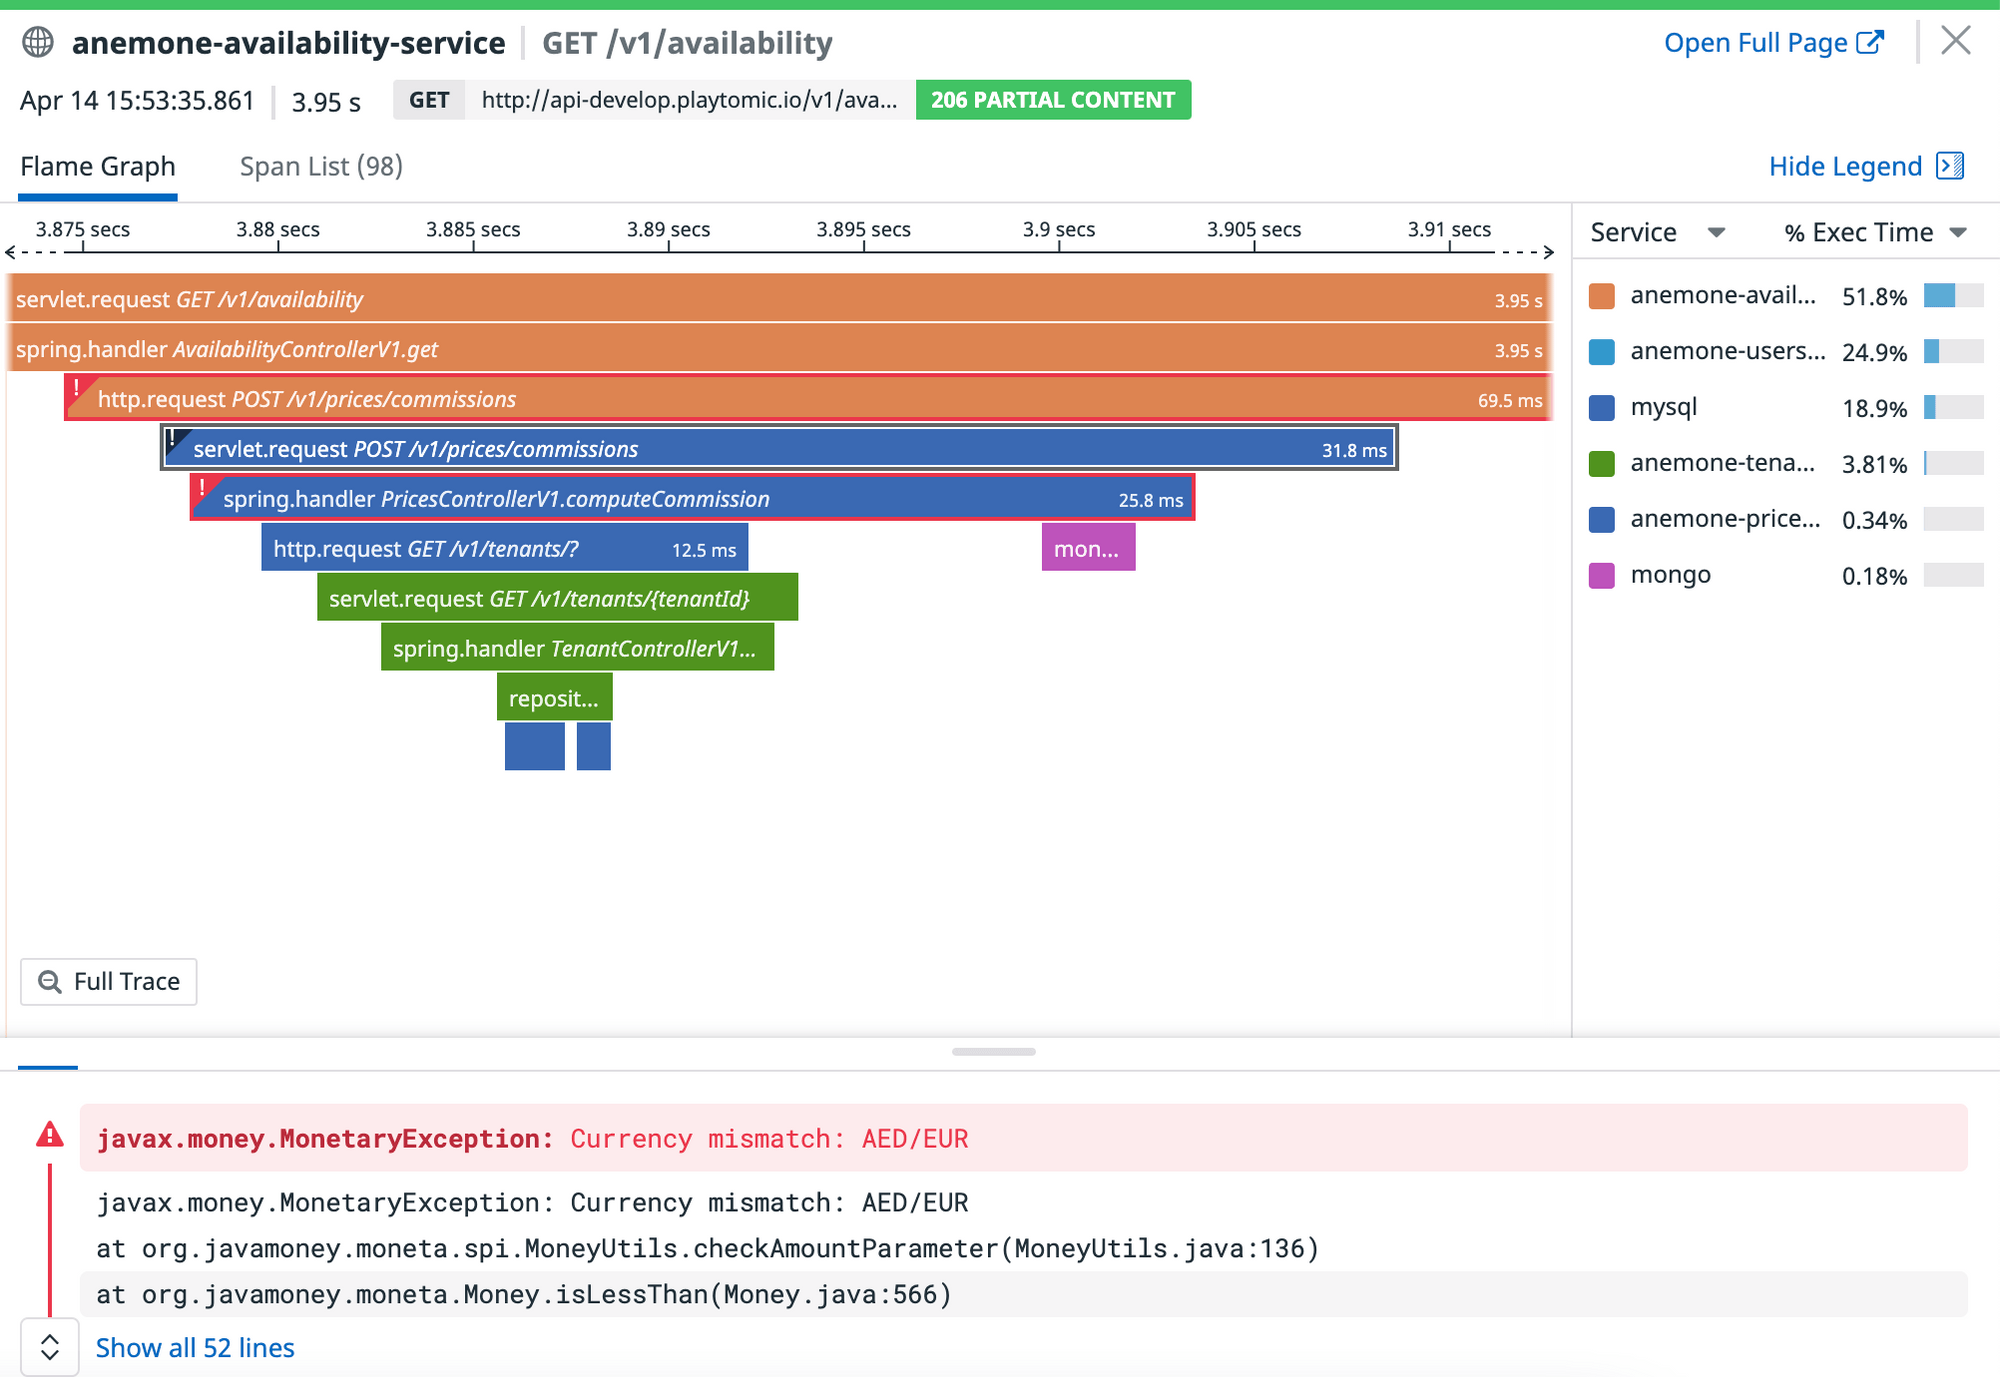
Traces are probably the newest in the trio.
In Playtomic, we followed the standard path: we started with in-house ELK (for logs) and prometheus (+ grafana). But we (developers) hate maintaining the infra: we run out of space, indexes get corrupted, … it is quite distracting. Therefore, we got rid of these in-house versions and moved those services to Datadog.
At that moment, we were already using distributed tracing to inject the trace and spain ids in our logs, so we can keep track of the requests among our microservices. So, with the Tracer already in place and the use of Datadog, the next natural step was using Trace to know more about our platform.
What’s next?
This SRE world is huge. Where are we heading to?
SLIs, SLOs, SLAs
Once you have your data (specially metrics), you can monitor your system. Welcome to the world of SLIs, SLOs, and SLAs.
- SLI: Indicator (Service Level): the number (for the tech team). Example: error_rate = % of requests with code >= 500.
- SLO: Objective (Service Level): the target (for the tech team). Example: keep error_rate < 99%
- SLA: Agreement (Service Level): the agreement (with the customer). Example: keep error_rate < 95%
SLOs are great because it gives you a hint when to spend more time in stability (paying technical debt, investing time researching problems, …).
RUM: Real User Monitoring
One step further: what if you could connect traces in your clients with your traces in your server? That’s where we are at this moment.
- Image: Ted Young https://twitter.com/tedsuo↩


